Reporting Automation: From Manual Spreadsheets to AI-Powered Dashboards
Editorial note: this article provides operational guidance. Examples and planning signals must be validated against your organisation’s own data, controls, and delivery context; they are not a promise of client outcomes.
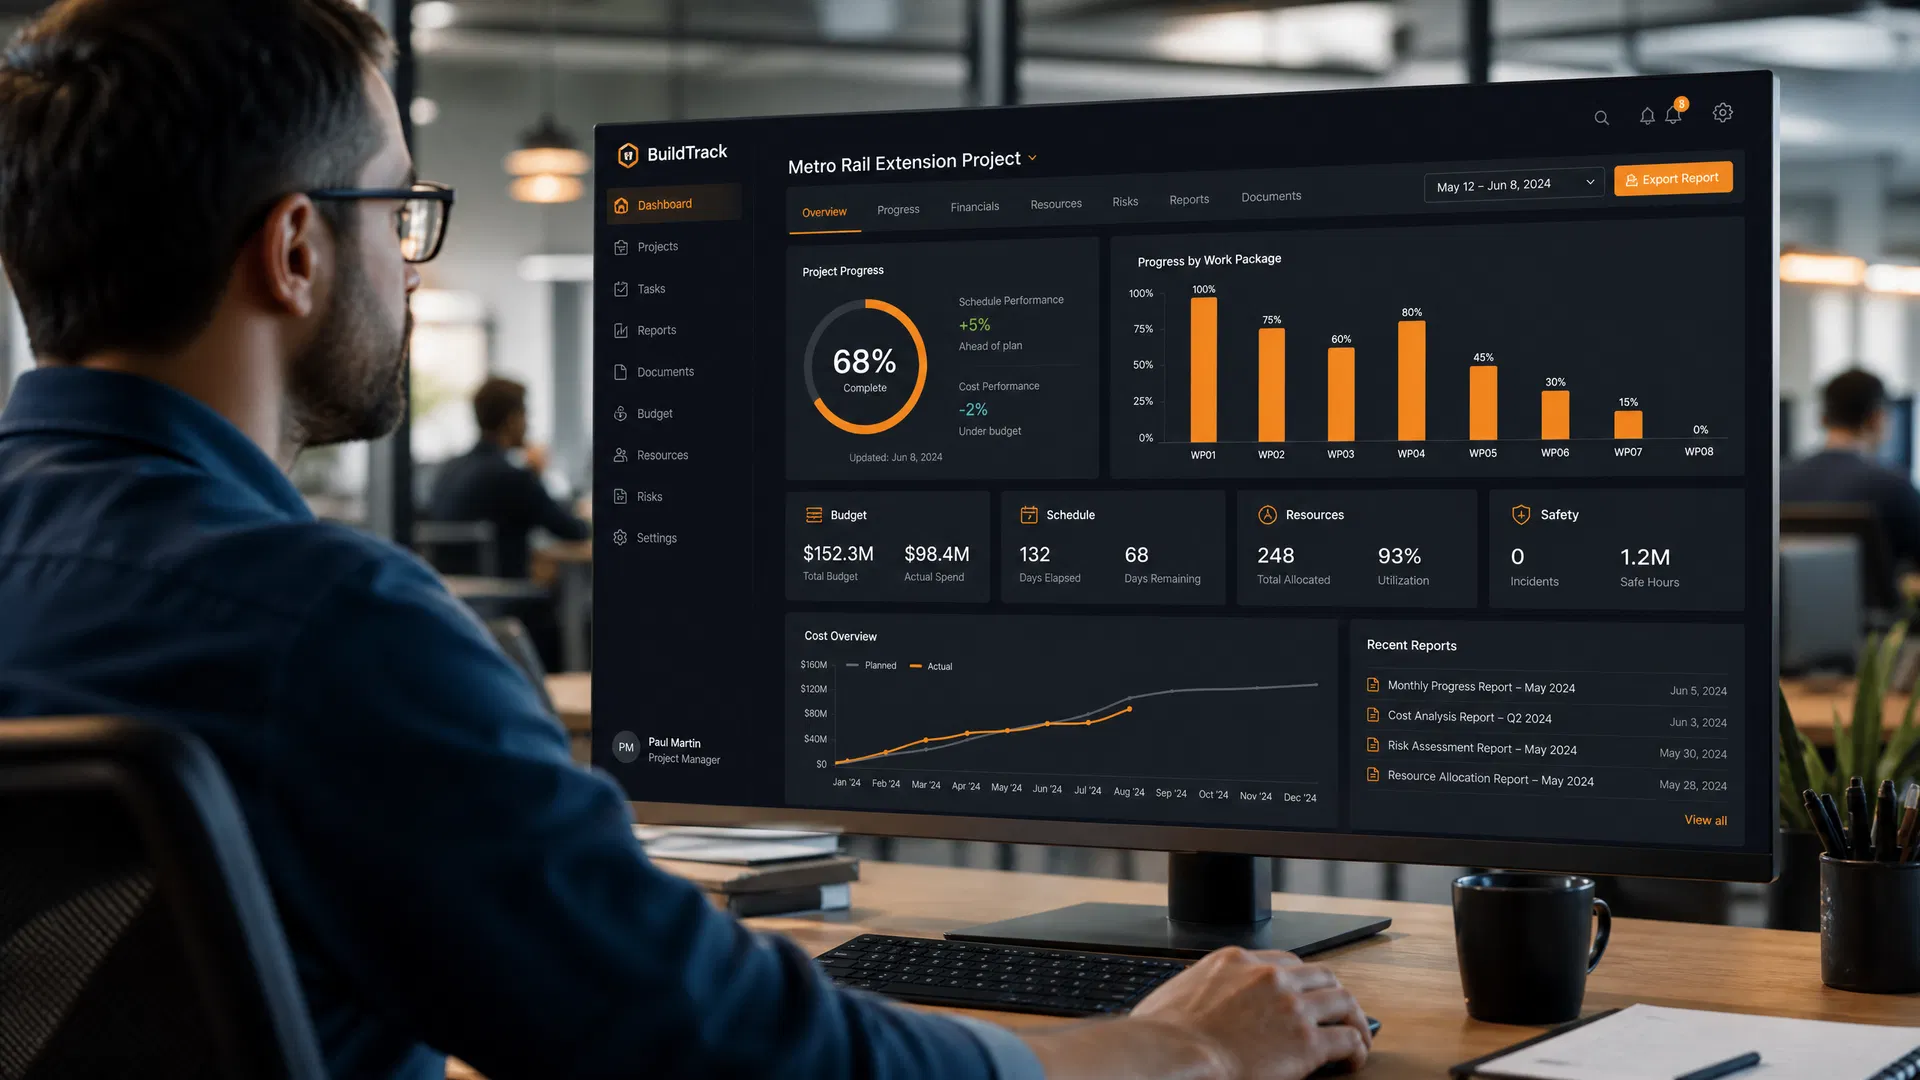
Project reporting is one of the most persistent and underestimated sources of management waste in project-based companies. In EPC, infrastructure, and engineering environments, project managers routinely spend eight to fifteen hours per week consolidating updates from multiple systems, formatting spreadsheets, and preparing reports that are often outdated by the time they reach a leadership inbox. This is not a minor inefficiency — it is a structural problem that compounds with portfolio complexity and actively degrades decision quality.
Why Manual Reporting Fails at Scale
The fundamental problem with manual reporting is not that people are doing it badly. Most project managers are diligent and capable. The problem is that the task itself is structurally unsuited to human effort. Consolidating data from five different systems, reconciling inconsistencies, formatting outputs to match a template, and writing narrative summaries is exactly the kind of high-volume, repetitive, pattern-following work that automated systems handle better than people — faster, more consistently, and without the cognitive fatigue that leads to errors on a Friday afternoon.
As project portfolios grow, the problem scales linearly. Adding a new project means adding another eight to fifteen hours of reporting burden. There is no economy of scale in manual reporting. Automation, by contrast, scales at near-zero marginal cost.
The Compounding Cost of Delayed Information
The direct cost of manual reporting — the hours spent — is only part of the problem. The indirect cost, which is harder to measure but often larger, is the cost of delayed information. When leadership receives a project status report that reflects conditions from three days ago, every decision made on the basis of that report carries an information lag. In fast-moving projects, three days is enough time for a risk to become a problem and a problem to become a crisis.
Field Observation
In one infrastructure firm we worked with, the operations director was making resourcing decisions on Monday morning based on Friday reports that reflected Thursday's data. By the time corrective action was taken, the window for low-cost intervention had already closed.
The Architecture of an Automated Reporting System
A well-designed reporting automation system has four distinct layers, each with a specific function. Understanding this architecture is important because it determines where integration complexity lives and where the highest-value components are.
Data Collection Layer
The collection layer connects to every system that holds project data — project management tools, accounting and ERP systems, time tracking platforms, email, and custom databases. It pulls data on a defined schedule, validates completeness, and flags missing or anomalous inputs before they propagate downstream. This layer is where most of the integration work happens, and it is typically the longest phase of implementation.
Data Processing Layer
The processing layer standardises formats, reconciles conflicts between systems, calculates derived metrics and KPIs, and identifies anomalies that require human attention. This is where raw data becomes information. A well-designed processing layer also maintains a historical record that enables trend analysis — something that is nearly impossible with manual reporting because historical data is rarely stored in a consistent, queryable format.
Intelligence Layer
The intelligence layer is where AI adds the most distinctive value. It reads the processed data and generates narrative summaries — the kind of plain-language commentary that currently requires a project manager to write. It identifies risks based on pattern recognition across the portfolio, highlights metrics that have moved outside acceptable ranges, and flags items that require leadership attention. The output is not a data dump but a structured, readable report that a senior manager can act on in ten minutes.
Delivery Layer
The delivery layer formats reports according to defined templates, generates visualisations and dashboards, distributes outputs via email or portal, and archives everything for compliance and audit purposes. Critically, it operates on a schedule — reports go out at the same time, every time, without anyone having to remember to send them.
A Realistic Implementation Timeline
Most companies can implement basic reporting automation within three to four months. The work breaks into six phases: current-state analysis, data integration, report design, AI configuration, parallel testing, and deployment. The parallel testing phase — running automated reports alongside manual ones for two to four weeks — is non-negotiable. It is the mechanism by which stakeholders build trust in the system before the manual process is retired.
The most common implementation failure is skipping the parallel testing phase because of schedule pressure. Teams that do this almost always face a trust crisis when the first automated report contains an error that the manual process would have caught. Running parallel for four weeks costs almost nothing relative to the cost of rebuilding stakeholder confidence after a credibility failure.
What to Expect After Deployment
Companies that implement reporting automation well typically see a seventy to eighty percent reduction in reporting time within the first quarter after deployment. Accuracy improves because manual data entry errors are eliminated. Leadership teams gain access to current project status rather than historical data. And the project managers who previously spent half their week on reporting get that time back for the work that actually requires their judgment — risk management, stakeholder relationships, and problem-solving.
The right place to start is your most time-consuming report. Automate that one first, measure the impact carefully, and use the results to build the case for expanding to the rest of your reporting portfolio.
Kumash Shah
Principal Consultant, Kresto Consulting
Kumash Shah is a Principal Consultant at Kresto Consulting, specialising in AI workflow transformation for project-based companies. With experience across EPC, infrastructure, and engineering environments, he helps organisations identify and implement practical AI solutions that drive measurable operational improvement.
Get More Insights
Practical perspectives on AI workflow transformation, delivered to your inbox.
Start the transformation.
Run the Workflow Intelligence Assessment to discuss how these insights apply to your specific operations.
Request a Workflow Review ↗